Dashboard
The Dashboard is your central view into everything happening across your OpenClaw gateway — sessions, token usage, errors, and system health, all updating in real time.
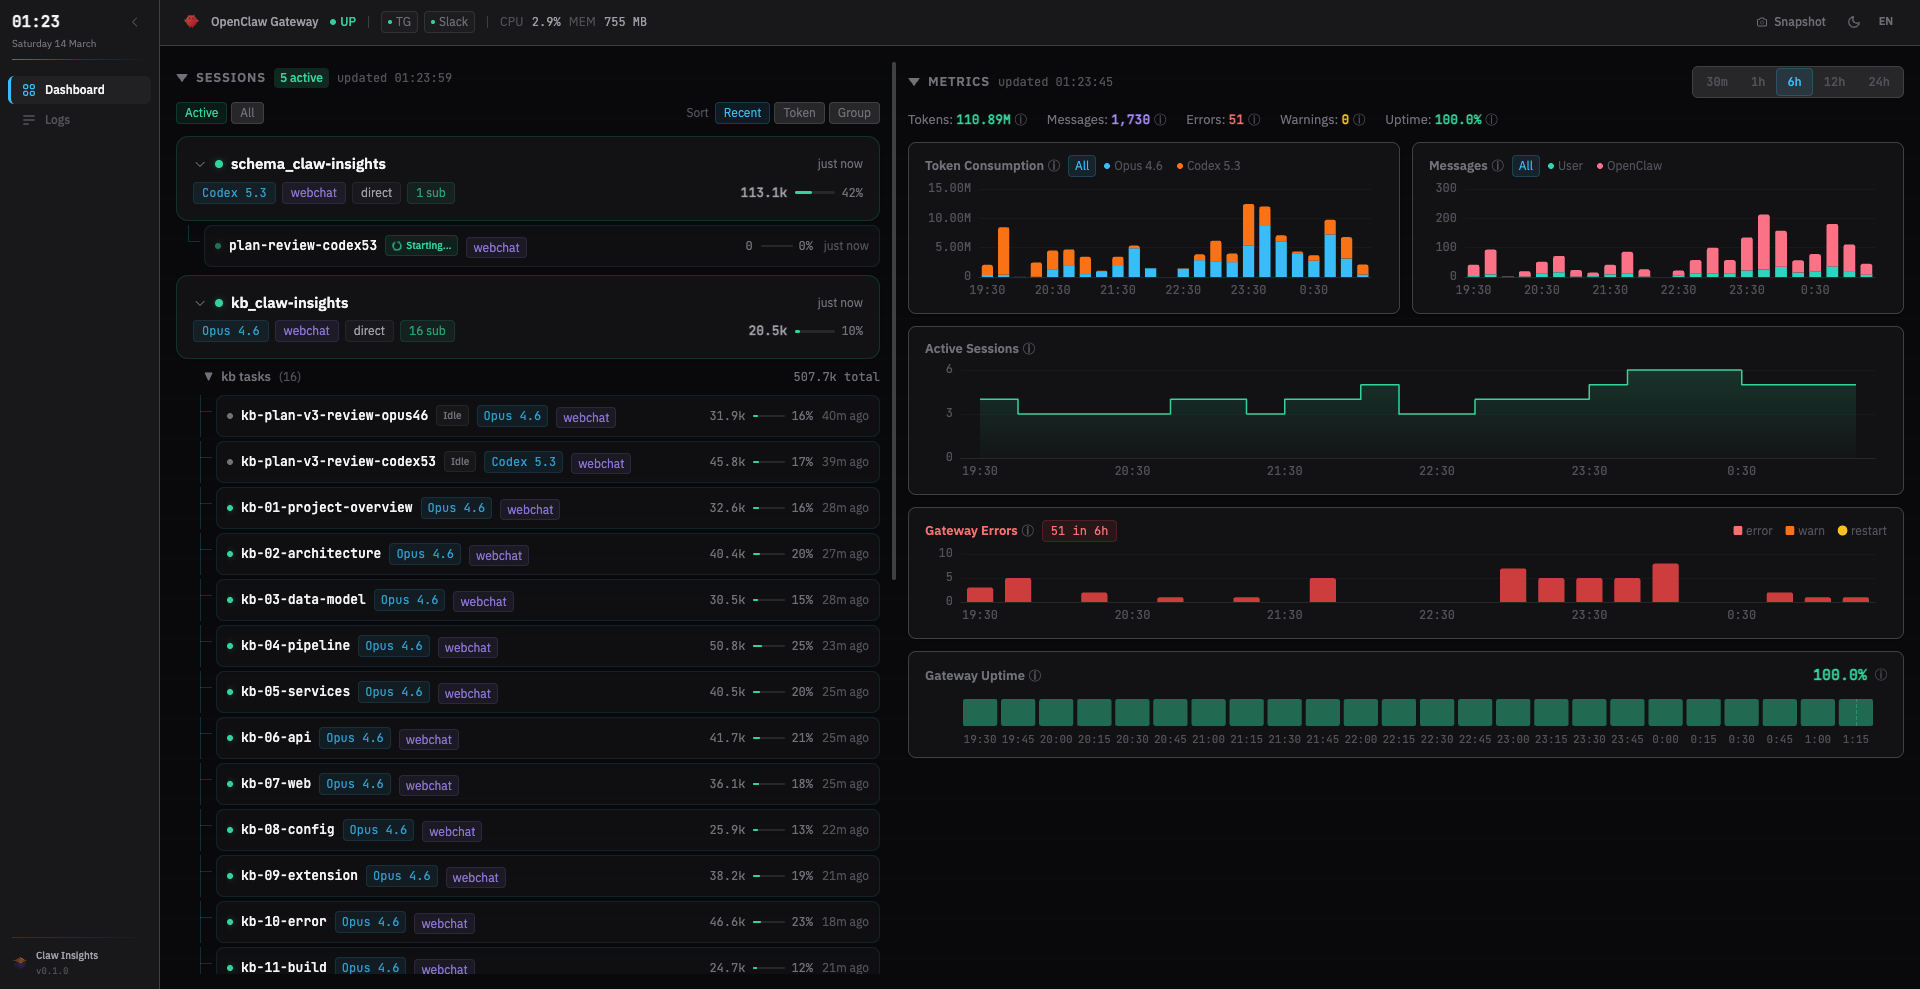
Session Cards
Each active or recent session is displayed as a card showing:
- Status indicator — Active 🟢, Idle ⚪, or Done 🔵
- Model — which LLM is powering the session
- Channel — where the session originated (e.g., Discord, Telegram, webchat)
- Token usage — input / output / cache token counts
- Turn count —
💬 N turnsshowing conversation length
Sub-Agent Tree
Sessions that spawn sub-agents display an expandable tree. Click to expand and see the full hierarchy — each child session links to its own Session Replay.
View Modes & Sorting
- View modes: Switch between Active (running sessions only) and All (including completed)
- Sorting: Order by Recent (newest first), Token (highest usage first), or Group (by channel/model)
Metrics Summary
A summary row at the top shows aggregate numbers at a glance:
- Total tokens consumed across all sessions
- Session count (active / total)
- Errors & warnings in the current time range
- Gateway uptime
Charts
Token Usage Chart
A stacked area chart showing token consumption over time, broken down by model. Hover over any point to see the exact per-model breakdown.
Errors & Warnings Chart
Visualizes error and warning frequency over time, helping you spot spikes and correlate them with specific sessions or deployments.
Time Granularity
Use the time picker to adjust the chart window: 30m · 1h · 6h · 12h · 24h.
Gateway Status Bar
The status bar shows your gateway's current state:
- Online / Offline indicator
- Version and uptime
- Connected channels with health status
Real-Time Updates
The dashboard uses GraphQL subscriptions (over SSE) to stay current. When data changes — a new session, a token update, an error — the affected components refresh automatically. No manual reload needed.
TIP
Click any session card to open the Session Drawer and explore the full Session Replay.