Session Replay
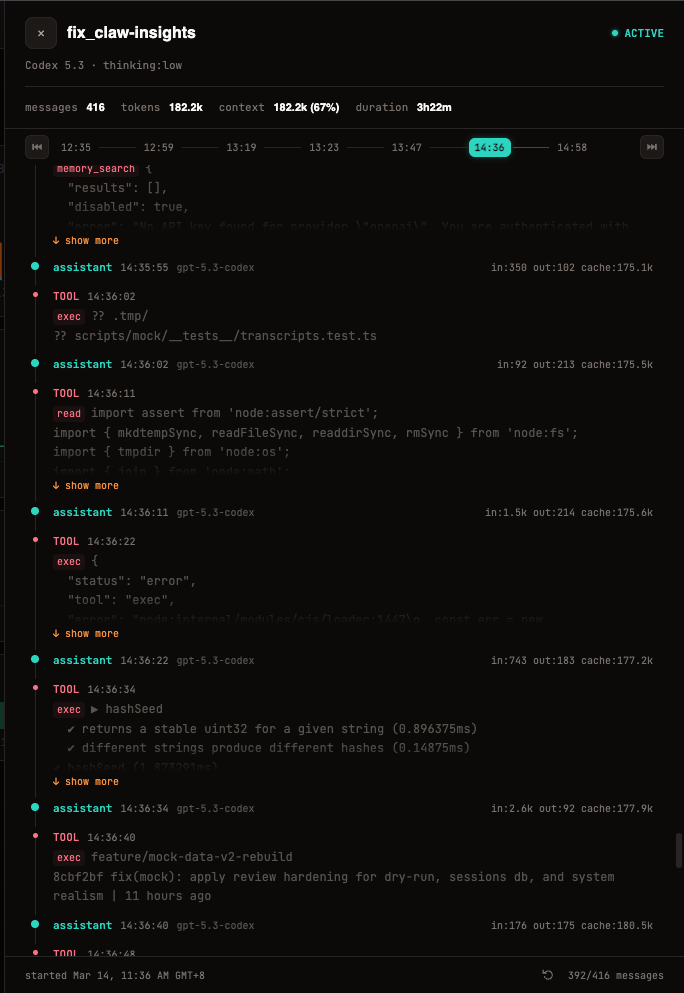
The Session Replay view lives inside the Session Drawer and shows the complete conversation history of any session as an interactive timeline.
Timeline Scrubber
A draggable scrubber bar sits at the top of the replay. Drag the handle to jump to any point in the conversation — message markers on the timeline show you where activity occurred.
The scrubber adjusts zoom automatically based on session duration, and the currently viewed message is always highlighted.
Turn Count
Each session displays a 💬 N turns indicator showing the total number of conversation turns. This count is tracked persistently via message events, so it remains accurate even for long-running sessions.
Message Types
Every entry in the replay is color-coded by type:
- User messages — what the human sent
- Assistant messages — the agent's replies
- Tool calls — tool invocations with name, arguments, and results
- System events — model switches, spawns, restarts, and other internal events
Token Breakdown
Each assistant message shows a token breakdown:
- Input tokens — prompt tokens consumed
- Output tokens — completion tokens generated
- Cache tokens — tokens served from cache
This helps you understand cost and context usage at the message level.
Sub-Agent Tracing
When a session spawns sub-agents, the replay shows:
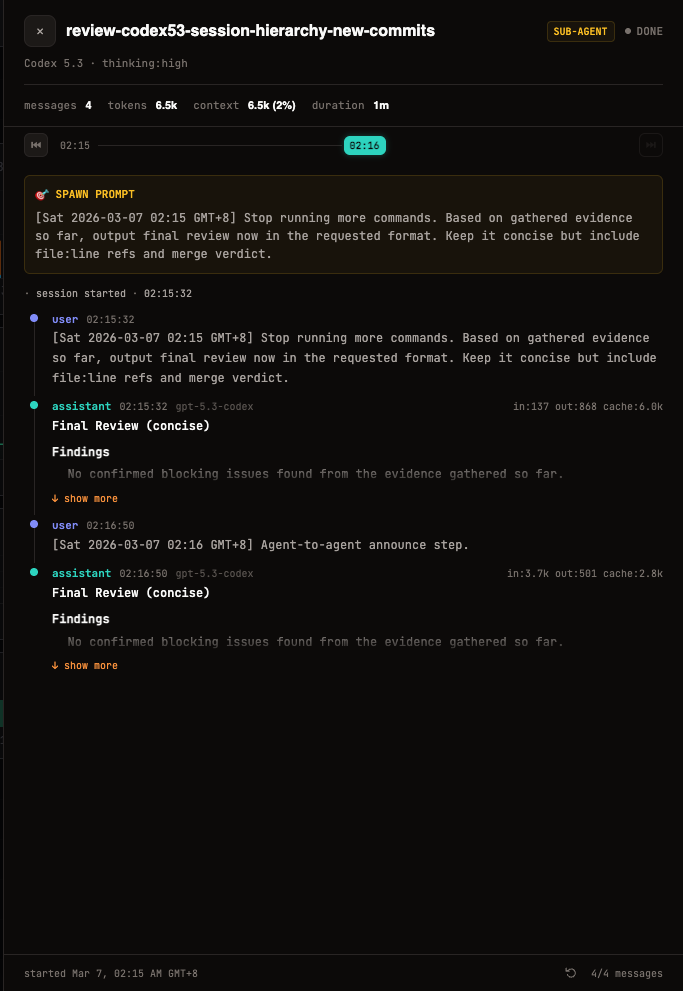
- The spawn prompt that created the sub-agent
- A parent → child link to navigate between sessions
- Nested sub-agent messages inline in the timeline
Virtual Scrolling
Long sessions (500+ messages) use virtual scrolling — only visible messages are rendered, so the UI stays smooth no matter how large the conversation.
Keyboard Navigation
| Key | Action |
|---|---|
↑ / ↓ | Step to previous / next message |
Home / End | Jump to start / end of session |
Enter | Expand a collapsed tool call or event |
TIP
Click any session card on the Dashboard to open the Session Drawer and start exploring the replay.